日本語|English (current)
-

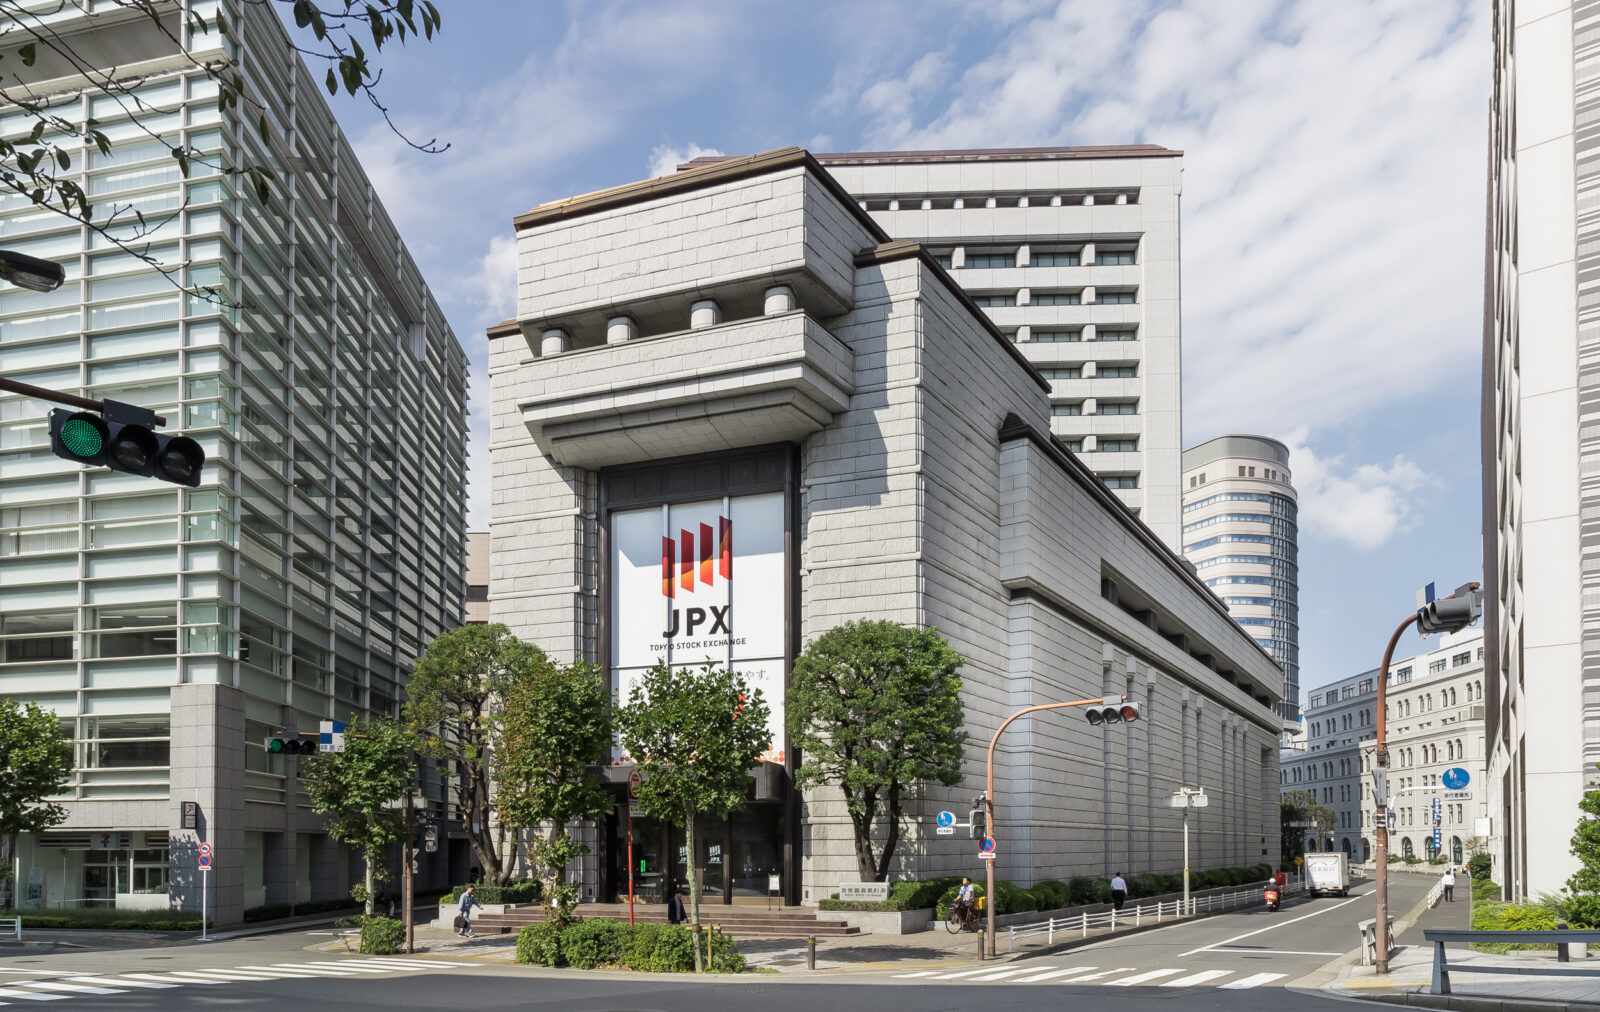
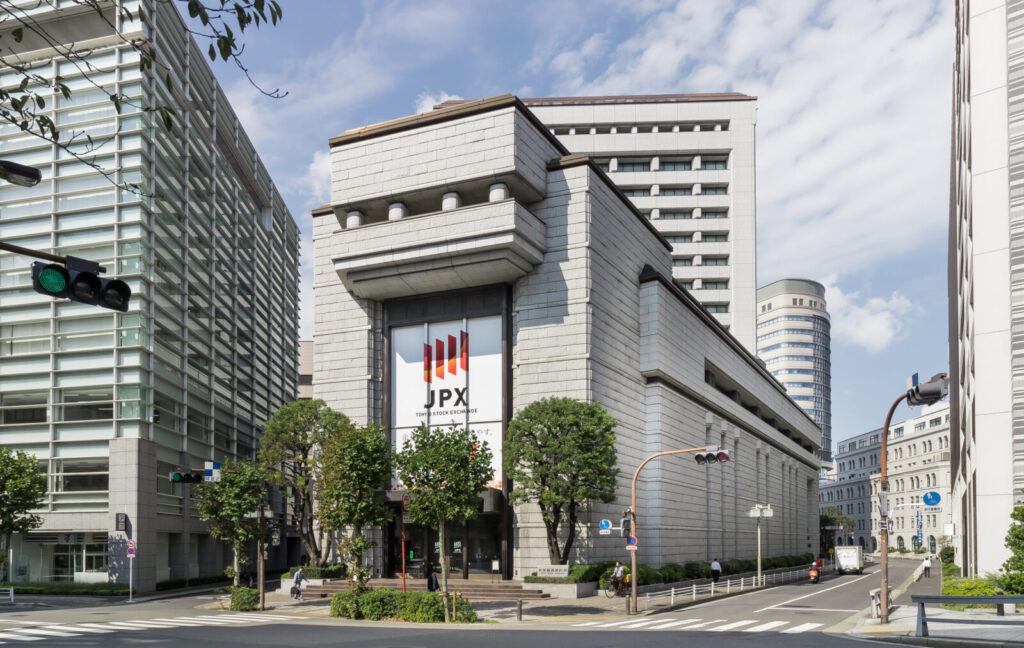
- 東京証券取引所ビル。建物は1988年完成、写真は2018年撮影。Kakidai/Wikimedia Commons/CC BY-SA 4.0。
On December 29, 1989, the Nikkei 225 closed at 38,915.87. Seen from the future, the number is a summit marker. Yet the people trading that day did not all believe in a fantasy. Japanese manufacturers were globally formidable. Investment was strong. Tokyo appeared to be consolidating its position as an international financial center. Office demand was real, and consumer-price inflation remained subdued. Contemporary data supplied reasons—some sound, some stretched far beyond their limits—for believing that high asset values could last.[1]
The useful question is therefore not why an entire country suddenly “went mad.” It is why the bank-centered institutions that had helped finance reconstruction and high-speed growth remained in place after their economic premises changed, and how those institutions turned land and share-price gains into expanding credit. A second question must be kept separate: why did falling asset prices become a banking crisis and then a stagnation lasting well beyond the original boom?
The answer can be stated directly:
The root cause was an asymmetric transition. Japan liberalized corporate access to securities markets and intensified competition while retaining a deposit-heavy banking system, administrative expectations against bank failure, restricted business models, and underwriting centered on land collateral. A system suited to scarce capital was not redesigned for an economy in which large firms had become financially self-sufficient.
The Plaza Accord and yen appreciation did not design the bubble. They triggered a domestic policy response. Prolonged monetary ease magnified the available credit. Land institutions, cross-shareholdings, nonbanks, and equity finance converted rising prices into further borrowing capacity. Rate increases and the quantitative restriction on real-estate lending helped reverse expectations, but they were triggers of the turn, not the root cause of the boom. What made the aftermath long was delayed loss recognition, inadequate bank capital, forbearance lending, interrupted macroeconomic support, and deflation.
- 1. What was the postwar Japanese economic system?
- 2. The premise changed: from capital shortage to corporate surplus
- 3. Why land collateral displaced cash-flow analysis
- 4. The Plaza Accord: shock, trigger, or root cause?
- 5. Why did neither officials nor financial institutions stop it?
- 6. Did the Bank of Japan and the lending restriction “burst” the bubble?
- 7. A sequence, not one collapse
- 8. Why was loss recognition delayed?
- 9. Jusen and the politics of public money
- 10. Was 1997–98 merely the continuation of the bust?
- 11. The major explanations: what each gets right—and misses
- 12. International comparison
- 13. Counterfactuals: what could realistically have been avoided?
- 14. The legacy
- Conclusion: the failure was not success, but transition
- Notes and references
1. What was the postwar Japanese economic system?
Postwar Japan was a capital-scarce economy. Households accumulated savings and placed much of them in bank and postal deposits. City banks, regional banks, sogo banks, shinkin banks, trust banks, and long-term credit banks channeled funds to firms with different sizes and funding horizons. Corporate bond markets were narrow and heavily regulated by later standards. Firms depended on indirect finance—funds intermediated through banks rather than raised directly from securities investors.
The main-bank system was more than repeated borrowing. A firm’s principal bank gathered private information, monitored management, supplied liquidity, and, when a borrower became distressed, coordinated other lenders and trading partners. Cross-shareholding and keiretsu relationships reinforced long-term ties. Long-term credit banks financed maturity-sensitive industrial projects. The Ministry of Finance controlled entry, branches, deposit rates, products, and the boundaries between banking and securities business. The Bank of Japan used window guidance, an administrative instrument intended to influence the pace of lending by individual institutions.[2]
This arrangement later became known as the convoy system: official control, protected margins, and a preference for preventing disorderly institutional failure. Before modern deposit insurance was fully credible, it was a practical way to protect payment and savings functions. Regulated spreads allowed banks to build reserves. Administrative coordination reduced the cost of reorganizing a troubled borrower.
The system also connected with lifetime employment, synchronized graduate recruitment, enterprise welfare, and stable corporate control. Banks could fund long-lived investments because companies and employment relationships were expected to endure. In an economy growing rapidly through factory building, technology adoption, infrastructure, and exports, expanding loan volume often did correspond to expanding productive capacity.
This does not mean bureaucrats or banks single-handedly created the Japanese miracle. Education, demographics, technology, world trade, competitive manufacturing, fiscal policy, and the international environment all mattered. The bank-centered system’s comparative advantage was narrower: under capital scarcity it could sustain long-term investment, accumulate information, and coordinate distress.
2. The premise changed: from capital shortage to corporate surplus
After the oil shocks, trend growth slowed. Large companies retained more earnings and became less dependent on bank loans. Government-bond markets deepened. Restrictions on corporate bonds, commercial paper, convertible bonds, warrant bonds, equity issuance, and overseas finance were gradually relaxed.
Liberalization was asymmetric. Highly rated companies could leave banks for capital markets, but household deposits remained within the banking system. Banks retained branch networks, employees, deposit costs, and an institutional expectation that they should preserve size and market share. At the same time, business-scope rules prevented an immediate transformation into diversified securities and advisory firms.
Hoshi and Kashyap identify this regulatory imbalance as a critical origin of the later crisis. Banks lost many of their safest corporate borrowers but did not shrink correspondingly. They searched for new customers among small and medium-sized firms, property companies, households, and nonbank financial institutions. Lending became more property-related.[3]
Risky expansion was not mechanically inevitable. Banks could have held safer securities, reduced balance sheets, or invested in cash-flow underwriting. Their decision to preserve volume reflected governance and policy incentives. Under high growth, “lend more” and “finance productive expansion” had often pointed in the same direction. After growth slowed, those instructions diverged. Competition was liberalized faster than resolution, supervision, and bank business models were redesigned.
3. Why land collateral displaced cash-flow analysis
New borrowers were often harder to evaluate than a large manufacturer with decades of bank records. Estimating future operating cash flow required new expertise. Land appeared observable, registrable, and saleable. A lender could refer to nearby transactions and assume that foreclosure would protect the principal.
The land myth—the idea that Japanese land, especially metropolitan land, would not decline—was not initially a baseless superstition. Postwar price history, concentration of population and headquarters functions, tight urban supply, redevelopment, inheritance-tax incentives, and preferential treatment of land all supplied plausible reasons for appreciation. The error was extrapolation: local and time-bound scarcity was turned into a national, permanent law, and values detached from rents and project cash flow were accepted as collateral.[4]
The resulting feedback was powerful. Higher land prices raised assessed collateral values. Larger loans financed more land purchases and development, supporting still higher prices. Cross-shareholdings linked the equity boom to bank capital: unrealized gains on share portfolios strengthened apparent balance sheets and, under the applicable capital treatment, supported lending capacity. Firms raised inexpensive funds through shares, convertible bonds, and warrant bonds and placed part of the proceeds in securities and property—a practice widely called zaitech.[5]
Land and equities were distinct markets with different regional and temporal peaks. They became one credit cycle through the interlocking balance sheets of banks, companies, nonbanks, and property developers.
4. The Plaza Accord: shock, trigger, or root cause?
-

- 1985年から1987年末までの円ドル相場。点線は1985年9月22日のプラザ合意。Monaneko/Wikimedia Commons/CC BY 3.0。データ:Federal Reserve。
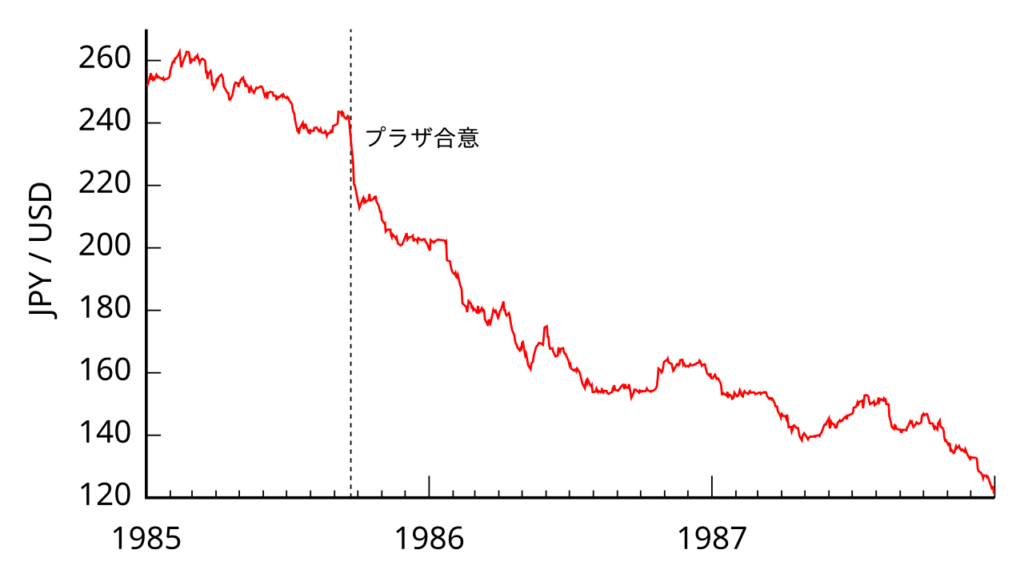
The September 1985 Plaza Accord among the United States, Japan, West Germany, France, and the United Kingdom sought an orderly correction of an overvalued dollar and international imbalances. The yen appreciated rapidly from around ¥240 per dollar. Exporters’ yen revenues and competitiveness came under pressure, creating the endaka fukyō, or high-yen recession.
The Bank of Japan cut the official discount rate five times between January 1986 and February 1987, from 5 percent to 2.5 percent. Initial easing was defensible. Yen appreciation posed a real macroeconomic shock. The more difficult judgment concerns the continuation of the 2.5 percent rate until May 1989.[6]
Several constraints were genuine. The February 1987 Louvre Accord shifted international coordination toward exchange-rate stabilization. The October 1987 global stock-market crash made central banks wary of tightening. Consumer prices were quiet. A policy framework centered on current goods-price inflation did not give an unambiguous signal to raise rates.
But consumer-price stability was not the same as financial stability. Credit, money, land prices, equities, and investment were rising together. Later work by Okina, Shirakawa, and Shiratsuka argues that monetary policy should assess the sustainability of price stability over a longer horizon and account for risks accumulated in balance sheets.[6]
The Plaza Accord was therefore an external shock and a catalyst for the policy response, not the bubble’s blueprint. International coordination did not dictate Japan’s land taxation, bank supervision, collateral practices, or treatment of jusen. How long to maintain ease, and whether to use supervisory tools against concentrated property credit, remained domestic choices.
-

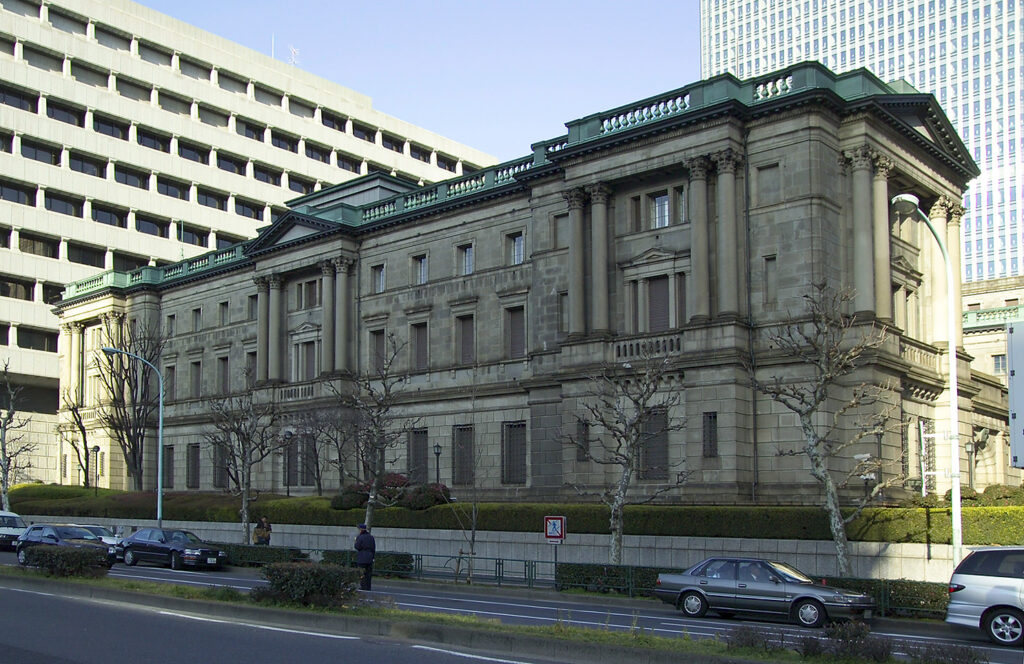
- 日本銀行本店。Fg2撮影/Wikimedia Commons/Public Domain。
5. Why did neither officials nor financial institutions stop it?
Real-time bubble identification is difficult. Office demand, redevelopment, internationalization, and corporate profitability offered fundamental explanations for some price growth. An early rate increase risked worsening the high-yen recession, employment, and the exchange rate. After Black Monday it could also have appeared internationally destabilizing.
Yet uncertainty did not justify inaction. Authorities did not need to prove a bubble in order to examine loan-to-value ratios, debt-service capacity, sectoral concentrations, related-company exposures, nonbank channels, and whether bank boards understood tail risk. Prudential policy could have targeted dangerous credit more directly than a large economy-wide interest-rate increase.
Responsibility was distributed but not equal. The Bank of Japan gave too little weight to credit and asset-price imbalances. The Ministry of Finance did not modernize supervision at the speed of liberalization and relied too long on informal administrative control. Bank managers defended loan volume and market share, allowed underwriting to depend on appreciation, and underestimated correlated exposure.
Politicians promoted domestic demand, resorts, and regional development. Corporations exploited equity finance and zaitech. Property firms, nonbanks, investors, and media amplified successful cases. But regulators who designed the rules and professional managers entrusted with deposits had obligations that an ordinary homebuyer did not. When individually rational lending creates a system-wide concentration, only governance and regulation can impose the missing restraint.
6. Did the Bank of Japan and the lending restriction “burst” the bubble?
The Bank raised the official discount rate from 2.5 to 3.25 percent in May 1989 and, through successive steps, to 6 percent in August 1990. In March 1990 the Ministry of Finance imposed the quantitative restriction on real-estate lending, instructing banks to keep the growth of lending to the property sector below the growth of total lending. Equities peaked at the end of 1989; land turned later and at different times across regions and uses.[7]
Rate increases and the restriction changed expectations and refinancing conditions. They were proximate triggers. The restriction was both late and abrupt. It incompletely covered nonbank channels, including jusen, and could shift rather than eliminate exposures.
But no policy could indefinitely sustain valuations that required continuous refinancing and appreciation. The restriction did not destroy an otherwise sound equilibrium. A more accurate judgment is that authorities permitted the cycle to become large and then stopped it with instruments poorly designed for a gradual adjustment.
7. A sequence, not one collapse
The expression “the bubble burst” compresses different phenomena:
| Stage | Main timing | Mechanism | Transmission |
|---|---|---|---|
| Equity reversal | From 1990 | Falling shares and hidden reserves | Weaker corporate finance and bank capital cushions |
| Land decline | From about 1991, with regional variation | Collateral and project values fall | Refinancing problems and insolvency |
| Nonperforming loans | Early 1990s onward | Delinquency, restructuring, borrower failure | Capital impairment and lending constraint |
| Systemic financial crisis | Especially 1997–98 | Major failures and distrust in funding markets | Credit contraction and Japan premium |
| Deflation and stagnation | Especially late 1990s onward | Weak demand, prices, wages, and expectations | Higher real debt and continued deleveraging |
The causes of formation and collapse were also different. Financial transformation and credit supply explain formation. Tightening and expectation reversal explain the turn. Losses and thin capital explain the banking crisis. Delayed cleanup, weak demand, and deflation explain persistence.
8. Why was loss recognition delayed?
Early in the decline, waiting could appear rational. If land recovered, another loan or maturity extension might preserve both borrower and collateral value. Foreclosure at a depressed price would crystallize a loss. A write-down would reduce bank capital and potentially force a contraction in new lending. Accounting, tax, disclosure, and inspection rules were not designed for rapid, transparent market-based assessment.
The option value of waiting disappeared as land continued to fall, but the incentives remained. Weak banks restructured loans, reduced interest, or supplied additional credit to weak firms. Peek and Rosengren show that troubled Japanese banks misallocated credit toward the weakest borrowers. Caballero, Hoshi, and Kashyap find that such zombie lending protected insolvent firms, suppressed market exit, and depressed investment and employment by healthier competitors.[8][9]
It is also inaccurate to claim that officials always knew the final loss and simply concealed it. Definitions widened during the 1990s. Collateral, affiliates, guarantees, and restructured claims were genuinely difficult to value. That uncertainty strengthens rather than weakens the case for independent asset review and a large capital buffer. Allowing banks’ optimistic self-assessment to substitute for both was a policy failure.
9. Jusen and the politics of public money
Jusen—housing-loan companies—were created in the 1970s to supplement mortgage finance. When their parent banks expanded directly into household mortgages, jusen moved into lending to property companies and development projects. They were funded by banks and agricultural and forestry financial institutions. The 1990 restriction did not initially cover them directly, allowing property finance to continue through a regulatory gap.
The resolution of seven jusen companies included a ¥685 billion fiscal contribution in 1996. Public opposition was intense because taxpayers appeared to absorb losses generated by banks, nonbanks, borrowers, and regulators without a clear hierarchy of responsibility.[10]
The problem was not that public capital can never be used. A banking collapse destroys payment, deposit, and credit functions far beyond bank shareholders. The political failure was to explain and enforce the order of loss: shareholders and managers first, then other risk-bearing claims as legally feasible, with public support directed to financial functions rather than incumbent owners. The jusen dispute made later recapitalization politically harder.
10. Was 1997–98 merely the continuation of the bust?
In April 1997 the consumption tax rose from 3 to 5 percent. Social-insurance and medical burdens also increased, while public investment shifted toward restraint. The Asian financial crisis began in July and weakened regional demand and confidence. In November, Sanyo Securities, Hokkaido Takushoku Bank, and Yamaichi Securities failed or announced closure. Sanyo’s default in the call market was particularly damaging because it challenged the safety of short-term interbank claims.[11]
-

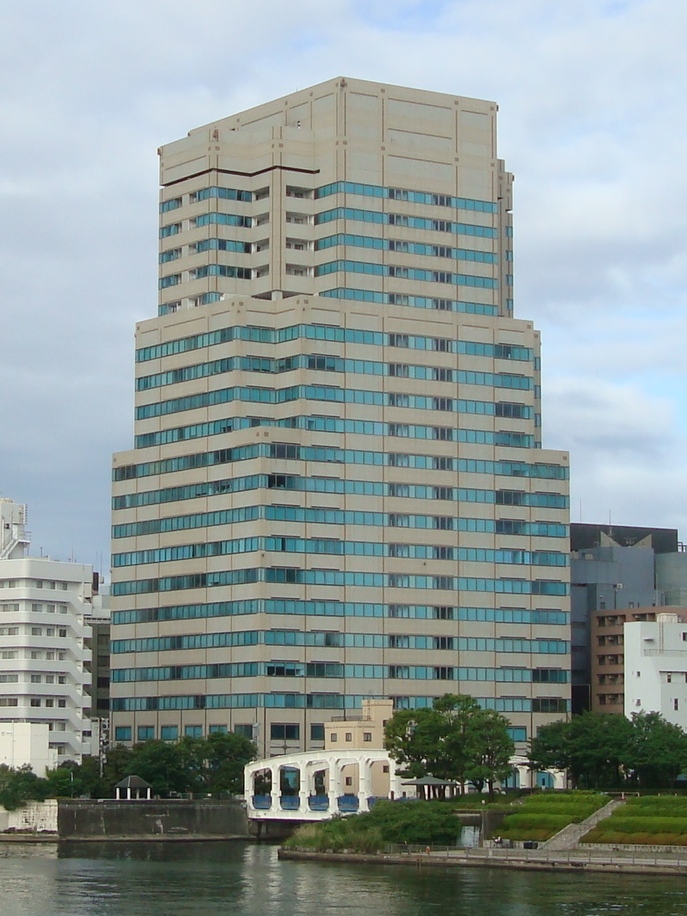
- かつて山一證券本社が置かれた茅場町タワー。写真は2012年撮影。Harani0403/Wikimedia Commons/CC BY-SA 3.0。
The crisis was neither wholly new nor merely the automatic continuation of 1990. Unresolved bad loans and inadequate capital were the combustible base. Fiscal withdrawal, the Asian crisis, and visible institutional failures were ignition mechanisms. Japanese banks faced a Japan premium in overseas dollar funding.
In 1998 Japan established stronger resolution and recapitalization frameworks under the Financial Reconstruction Act and the Financial Function Early Strengthening Act. The Long-Term Credit Bank of Japan entered temporary public control in October, and Nippon Credit Bank followed in December.[12]
-

- 新生銀行旧本社ビル。旧日本長期信用銀行の後身にあたる新生銀行が使用した建物。写真は2006年撮影。Lombroso/Wikimedia Commons/Public Domain。

11. The major explanations: what each gets right—and misses
Okina, Shirakawa, and Shiratsuka: monetary and financial imbalance
This line of Bank of Japan research emphasizes prolonged ease, bullish expectations, and the accumulation of risk under apparently stable consumer prices. Its strength is to connect monetary policy with balance-sheet fragility and to acknowledge real-time constraints. Its limitation is institutional: it is also a retrospective assessment by economists closely connected to the central bank.
Hoshi and Kashyap: asymmetric deregulation and weak bank capital
Their account connects large firms’ migration to securities markets, banks’ search for borrowers, property-linked lending, and delayed recapitalization. It best explains why credit went where it did. It requires supplementation on aggregate demand and deflation.
Bernanke, Posen, and Cargill: insufficient macroeconomic response
These authors place greater responsibility on monetary caution, deflation, and, in Posen’s work, premature fiscal consolidation. They show that zero nominal rates do not exhaust central-bank capacity: commitments, asset purchases, and policies to raise inflation expectations remained possible. Their weakness is that monetary stimulus cannot by itself recapitalize insolvent banks or make overindebted firms willing to borrow.[15]
Koo: the balance-sheet recession
Koo argues that firms shifted from profit maximization to debt minimization after asset values collapsed. This explains why low rates did not produce normal credit demand and why fiscal deficits could support demand during private deleveraging. The account is less complete on bank supply constraints, zombie lending, and productivity-enhancing reallocation.
Peek and Rosengren; Caballero, Hoshi, and Kashyap: forbearance and zombies
These studies use bank and firm data to show how undercapitalized banks protected weak borrowers and distorted competition. They provide the strongest microeconomic account of persistence. Classification of zombies and the exact aggregate magnitude remain debated.
The evidence does not support saying that everyone was “partly right” without ranking mechanisms. For the boom, asymmetric financial reform plus monetary and collateral amplification has the greatest explanatory power. For the first half of the 1990s, delayed recognition and bank capital are central. For the late 1990s, those financial weaknesses interacted with insufficient demand, fiscal reversal, and deflation. Bank cleanup was not the only necessary policy, but its delay reduced the effectiveness of every other policy.
12. International comparison
The U.S. savings-and-loan crisis shared deregulation, an interest-rate shock, deposit-insurance moral hazard, and regulatory forbearance. The Nordic banking crises followed rapid liberalization, credit growth, and property booms. The Asian crisis centered more heavily on short-term foreign-currency debt and exchange-rate regimes, unlike Japan’s mainly domestic-currency balance-sheet crisis. In 2008, securitization and wholesale funding spread losses across markets; in Japan, banks held impaired claims and concealed or rolled them over.[13]
Sweden and other Nordic countries are not frictionless models, but they moved relatively quickly toward explicit guarantees, asset recognition, recapitalization, and the imposition of losses on owners and managers. Japan’s cross-shareholdings, main-bank ties, administrative discretion, and hopes of land recovery made restructuring and political loss allocation slower.
The comparative lesson is not that Japanese culture caused delay. Similar credit cycles occurred elsewhere. Japan’s distinctive institutions determined where losses remained and how difficult they were to recognize.
13. Counterfactuals: what could realistically have been avoided?
An increase in rates in 1987 or 1988 might have reduced the late-stage boom, but it risked further yen appreciation and stress after Black Monday. It could not guarantee prevention. Earlier loan-to-value rules, debt-service tests, sectoral concentration limits, and consolidated supervision of banks and nonbanks were more targeted and plausibly feasible.
A phased real-estate restriction that included jusen could have reduced both the abrupt stop and regulatory leakage. It could not make already inflated assets painless.
In the early 1990s, independent asset review followed by sufficiently large recapitalization could probably have reduced forbearance and the severity of the 1997 crisis. Political resistance, legal gaps, and uncertainty over losses were real constraints, but they did not make action impossible. Avoiding the 1997 fiscal withdrawal could have reduced the recession. Earlier zero-rate and unconventional monetary policies could have limited deflation and the rise in real debt burdens.
No alternative would have erased the capital loss already embedded in inflated land and equities. Japan probably could not have achieved an entirely painless soft landing. But the size of the late boom, its conversion into systemic banking distress, and much of the duration of stagnation were policy-contingent.
14. The legacy
Japan eventually strengthened inspection, disclosure, capital standards, corporate governance, and resolution. Cross-shareholding declined and major banks consolidated. The Financial Services Agency reports that the major-bank NPL ratio fell from 8.4 percent in March 2002 to 2.9 percent in March 2005.[14]
Other legacies persisted: corporate preference for cash, collateral and guarantee dependence in parts of banking, regional-bank profitability problems, labor-market dualism, and high public debt. Synchronized graduate recruitment amplified the human cost. Those who entered the labor market during the employment ice age often missed the gateway to stable, seniority-linked careers, with effects on later earnings and family formation. The bubble cannot explain Japan’s entire demographic problem, but prolonged insecurity is one relevant transmission channel.
Conclusion: the failure was not success, but transition
The causal hierarchy is now clear:
- Structural conditions: indirect finance, administrative protection, land collateral, and cross-shareholding.
- Primary institutional cause: large firms escaped to direct finance while banks, deposits, safety expectations, and governance changed too slowly.
- External shock: yen appreciation after the Plaza Accord.
- Domestic amplification: prolonged ease, domestic-demand policy, delayed supervision, and a land-equity-nonbank credit loop.
- Turning triggers: rate increases, the lending restriction, tax changes, and reversal of expectations.
- Crisis transmission: falling collateral, bad loans, thin bank capital, and institutional failures.
- Persistence: delayed recognition and recapitalization, zombie lending, the compound shocks of 1997, deflation, and private deleveraging.
The postwar system was not inherently irrational. It worked under capital scarcity, rapid growth, regulated markets, and long-lived corporate relationships. The failure was to leave unresolved who would bear loss, how banks should shrink or transform, and how concentrated credit should be supervised after those conditions disappeared.
In one sentence: Japan’s bubble and long stagnation resulted from a failed institutional transition—the bank-centered machinery of high growth was not rebuilt for a liberalized, capital-surplus economy, so it magnified credit through land on the way up and prolonged stagnation by refusing loss on the way down.
日本語|English (current)
Notes and references
Primary sources and policy documents
- Japan Exchange Group, JPX Report 2021, historical market data; Bank of Japan and Ministry of Land data for credit and land. JPX annual reports.
- Bank of Japan, “The Basic Discount Rate and Basic Loan Rate,” historical changes. Bank of Japan.
- Ministry of Finance, “Concerning the Restraint of Land-Related Financing,” March 1990; Bank of Japan historical policy materials.
- National Diet Library, Diet Proceedings Search System, jusen debates, 1995–96. Diet Proceedings Search System.
- International Monetary Fund, “Japan’s Economic Crisis and Policy Options,” World Economic Outlook, October 1998, ch. IV. IMF report.
- Financial Services Agency, “Japan’s Financial Sector Reform: Progress and Challenges,” 2001. FSA.
- Financial Services Agency, data on normalization of major banks’ NPL problems, 2005. FSA NPL data.
Research
- Takeo Hoshi and Anil K Kashyap, Corporate Financing and Governance in Japan: The Road to the Future, MIT Press, 2001, chs. 1–4.
- Takeo Hoshi and Anil K Kashyap, “The Japanese Banking Crisis: Where Did It Come from and How Will It End?” in NBER Macroeconomics Annual 1999, 2000, pp. 129–201. NBER paper.
- Policy Research Institute for Land, Infrastructure, Transport and Tourism, research on Japan’s land-price formation around the bubble period.
- Masazumi Hattori, Hyun Song Shin and Wataru Takahashi, “A Financial System Perspective on Japan’s Experience in the Late 1980s,” IMES Discussion Paper 2009-E-19. IMES paper.
- Joe Peek and Eric S. Rosengren, “Unnatural Selection: Perverse Incentives and the Misallocation of Credit in Japan,” American Economic Review 95(4), 2005, pp. 1144–1166. DOI.
- Ricardo J. Caballero, Takeo Hoshi and Anil K. Kashyap, “Zombie Lending and Depressed Restructuring in Japan,” American Economic Review 98(5), 2008, pp. 1943–1977. DOI.
- Burkhard Drees and Ceyla Pazarbaşioğlu, The Nordic Banking Crises: Pitfalls in Financial Liberalization?, IMF Occasional Paper 161, 1998. DOI.
- Ben S. Bernanke, “Japanese Monetary Policy: A Case of Self-Induced Paralysis?” 2000. Paper; Adam S. Posen, Restoring Japan’s Economic Growth, Institute for International Economics, 1998; Thomas F. Cargill, “Monetary Policy, Deflation, and Economic History,” Monetary and Economic Studies 19(S-1), 2001.
Core monetary-policy studies
- Kunio Okina, Masaaki Shirakawa and Shigenori Shiratsuka, “The Asset Price Bubble and Monetary Policy: Japan’s Experience in the Late 1980s and the Lessons,” Monetary and Economic Studies 19(S-1), 2001, pp. 395–450. IMES paper.
- Shigenori Shiratsuka, “The Asset Price Bubble in Japan in the 1980s,” IMES Discussion Paper 2003-E-15. IMES paper.
- Richard C. Koo, The Holy Grail of Macroeconomics: Lessons from Japan’s Great Recession, Wiley, 2008.
Accessed July 17, 2026.